
Data science has been called the sexiest profession of the 21st Century—but you could be forgiven for thinking that the job description sounds anything but. As an interdisciplinary field, data science incorporates scientific methods, algorithms, systems, and processes in the study and management of data. Working in the field involves handling processes like data engineering, data visualization, advanced computing, and machine learning. Feeling hot under the collar yet?
Fortunately, there are a range of powerful tools that make all of the above achievable for data scientists. A big part of becoming a data scientist is understanding how to utilize these tools meaningfully in your role.
This article takes a look at some of the popular tools used in data science and what they can do. We’ll finish up by taking a look at some of the popular data science job descriptions where you’re likely to use these tools in your day to day role.
SQL: SQL (Structured Query Language) is considered the holy grail of data science. You won’t get very far in this field without knowledge of this important tool. SQL is a domain-specific programming language used for managing data. It’s designed to enable access, management, and retrieval of specific information from databases. As most companies store their data in databases, proficiency in SQL is essential in the field of data science. There are several types of databases, like MySQL, PostgreSQL, and Microsoft SQL Server. Since most of them recognize SQL, it’s easy to work on any of them if you have a thorough knowledge of SQL. Even if you’re working with another language, like Python, you’ll still need to know SQL to access and manage the database to work with the information.
ggplot2 ggplot2 is an advanced data visualization package for the R programming language. The developers created this tool to replace the native graphics package of R and it uses powerful commands to create illustrious visualizations.
It is the most widely used library that Data Scientists use for creating visualizations from analyzed data.Ggplot2 is part of tidyverse, a package in R that is designed for Data Science.
One way in which ggplot2 is much better than the rest of the data visualizations is aesthetics. With ggplot2, Data Scientists can create customized visualizations in order to engage in enhanced storytelling.
Using ggplot2, you can annotate your data in visualizations, add text labels to data points and boost intractability of your graphs. You can also create various styles of maps such as choropleths, cartograms, hexbins, etc. It is the most used data science tool.
Apache Spark: Spark is a powerful analytics engine. It’s one of the most popular and most-used data science tools.It was specially created to perform stream processing and batch processing of data. Stream processing means processing the data as soon as it’s produced, while batch processing is the running of jobs in batches, as opposed to individually.
BigML: BigML is a leading machine learning platform and one of the most widely used data science tools. It features a completely intractable graphics user interface (GUI) environment that is cloud-based. BigML uses cloud computing to deliver standardized software across various different industries. Organizations can use it to employ machine learning algorithms across the board.
SAS: This data science tool is designed especially for statistical operations. It is a closed-source proprietary software tool that specializes in handling and analyzing massive amounts of data for large organizations. It’s well-supported by its company and very reliable. Still, it’s a case of getting what you pay for because SAS is expensive and best suited for large companies and organizations.
Excel: Excel is a powerful analytical tool for Data Science. While it has been the traditional tool for data analysis, Excel still packs a punch. Excel comes with various formulae, tables, filters, slicers, etc. You can also create your own custom functions and formulae using Excel. While Excel is not for calculating the huge amount of Data, it is still an ideal choice for creating powerful data visualizations and spreadsheets.
You can also connect SQL with Excel and can use it to manipulate and analyze data. A lot of Data Scientists use Excel for data cleaning as it provides an interactable GUI environment to pre-process information easily.
With the release of ToolPak for Microsoft Excel, it is now much easier to compute complex analyzations. However, it still pales in comparison with much more advanced Data Science tools like SAS. Overall, on a small and non-enterprise level, Excel is an ideal tool for data analysis.
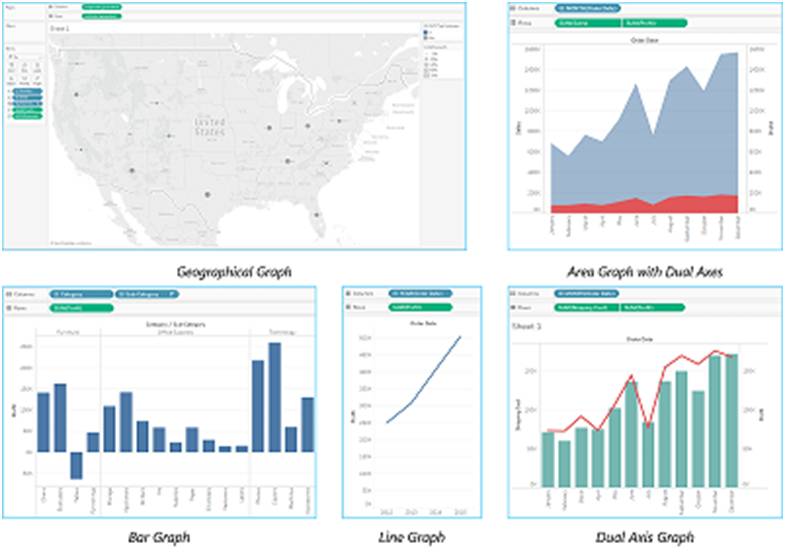
Tableau is the most popular data visualization tool used in the market. It allows you to break down raw, unformatted data into a processable and understandable format. Visualizations created by using Tableau can easily help you understand the dependencies between the predictor variables.
Scikit-learn is a Python-based library that is packed with numerous unsupervised and supervised ML algorithms. It was designed by combining features of Pandas, SciPy, NumPy, and Matplotlib. Scikit-learn supports various functionalities for implementing Machine Learning Algorithms such as classification, regression, clustering, data pre-processing, model selection, and dimensionality reduction, to name a few. The primary job of Scikit-learn is to simplify complex ML algorithms for implementation. This is what makes it so ideal for applications that demand rapid prototyping.
Apache Hadoop: Apache Hadoop works by dividing the data sets over a cluster of thousands of computers. Data scientists use Hadoop for high-level computations and data processing. Its stand-out features include:
effectively scaling large data in clusters;
ScientistExpress offers a five month data science course along with 2 months extensive high value industry projects. Each course is taught by experts in the field, and includes consistent one-on-one mentorship to assist you while learning the curriculum and tackling the real-world projects. Following the career transition, you get six months of handholding that will help you settling down in your new profession.
An online data science course aimed at helping you launch a career. Students from 33 countries and counting, meet the 100+ alumni’s who cracked career in data science. Contact at +91 8806930487 or drop a mail at scientistexpress@gmail.com for a free demo class.
VIEW OUR CURRICULUM
Career in Data Science
Learn Data Science
Beginner’s Guide

Copyright 2024 Scientistexpress. Designed By Finplus | All rights reserved.